Analytics Features
- Real-Time Insights
- Quality Analysis
- Performance Tracking
Immediate Visibility:
- Monitor candidate quality as applications flow in
- Track scoring patterns across sourcing channels
- Identify quality trends in real-time
- Make quick adjustments to recruitment strategy
- Scores update as candidates are processed
- Distribution charts reflect latest applications
- Pipeline metrics refresh automatically
Core Metrics
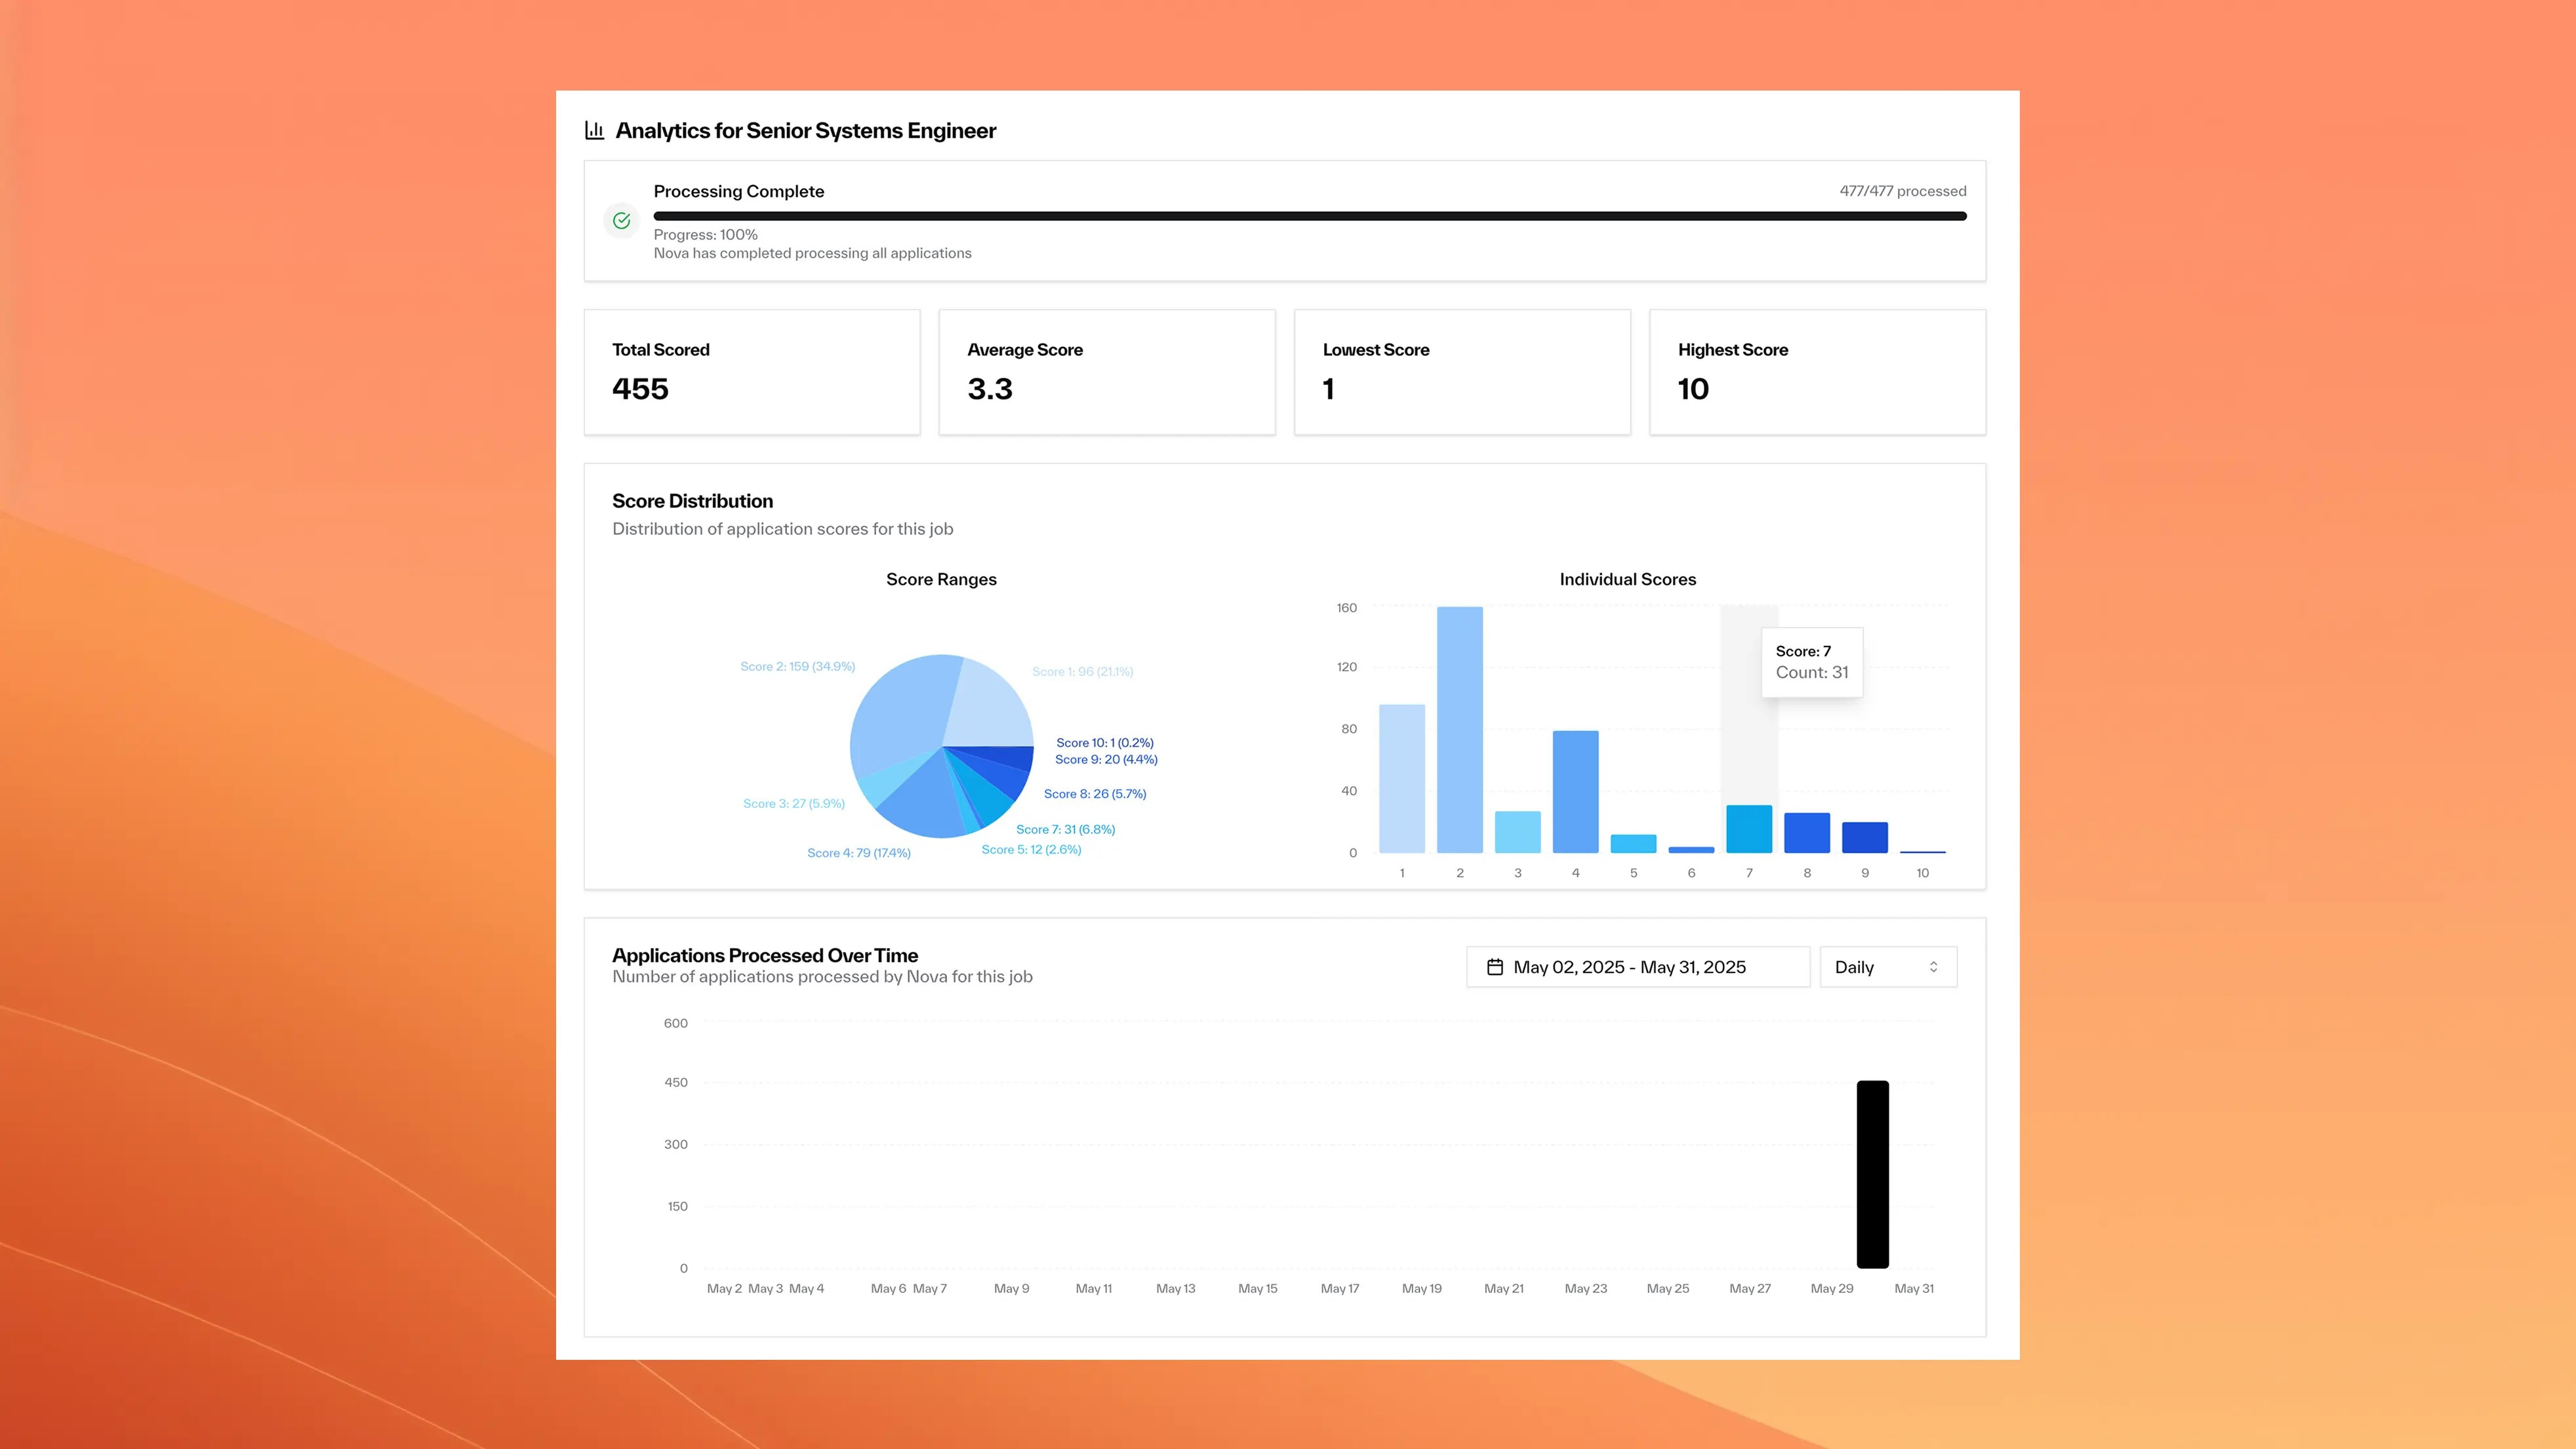
Score Distribution Analysis
View how candidates break down by quality scores, from poor matches to exceptional fits. Key Metrics:- Quality Breakdown: High-quality (7+) vs poor matches percentage
- Distribution Patterns: Whether sourcing attracts the right talent
- Average Score Tracking: Overall pipeline quality over time
- Volume Analysis: Application quantity vs quality balance
Performance Benchmarking (Coming Soon)
Cross-Role Comparison
Cross-Role Comparison
- See which positions attract higher quality candidates
- Identify successful job posting patterns
- Benchmark across different teams and roles
- Share best practices across hiring managers
Processing Analytics
Processing Analytics
- Track application volumes and scoring throughput
- Monitor system performance and response times
- Identify peak application periods and patterns
- Optimize resource allocation and timing
Quality Trends
Quality Trends
- Identify improvement or decline patterns over time
- Seasonal hiring quality variations
- Impact of criteria changes on candidate quality
- ROI analysis for different recruitment strategies
Outlier Identification
Outlier Identification
- Spot candidates who significantly exceed expectations
- Identify patterns in top-performer characteristics
- Benchmark exceptional candidates against criteria
- Refine sourcing to attract similar quality
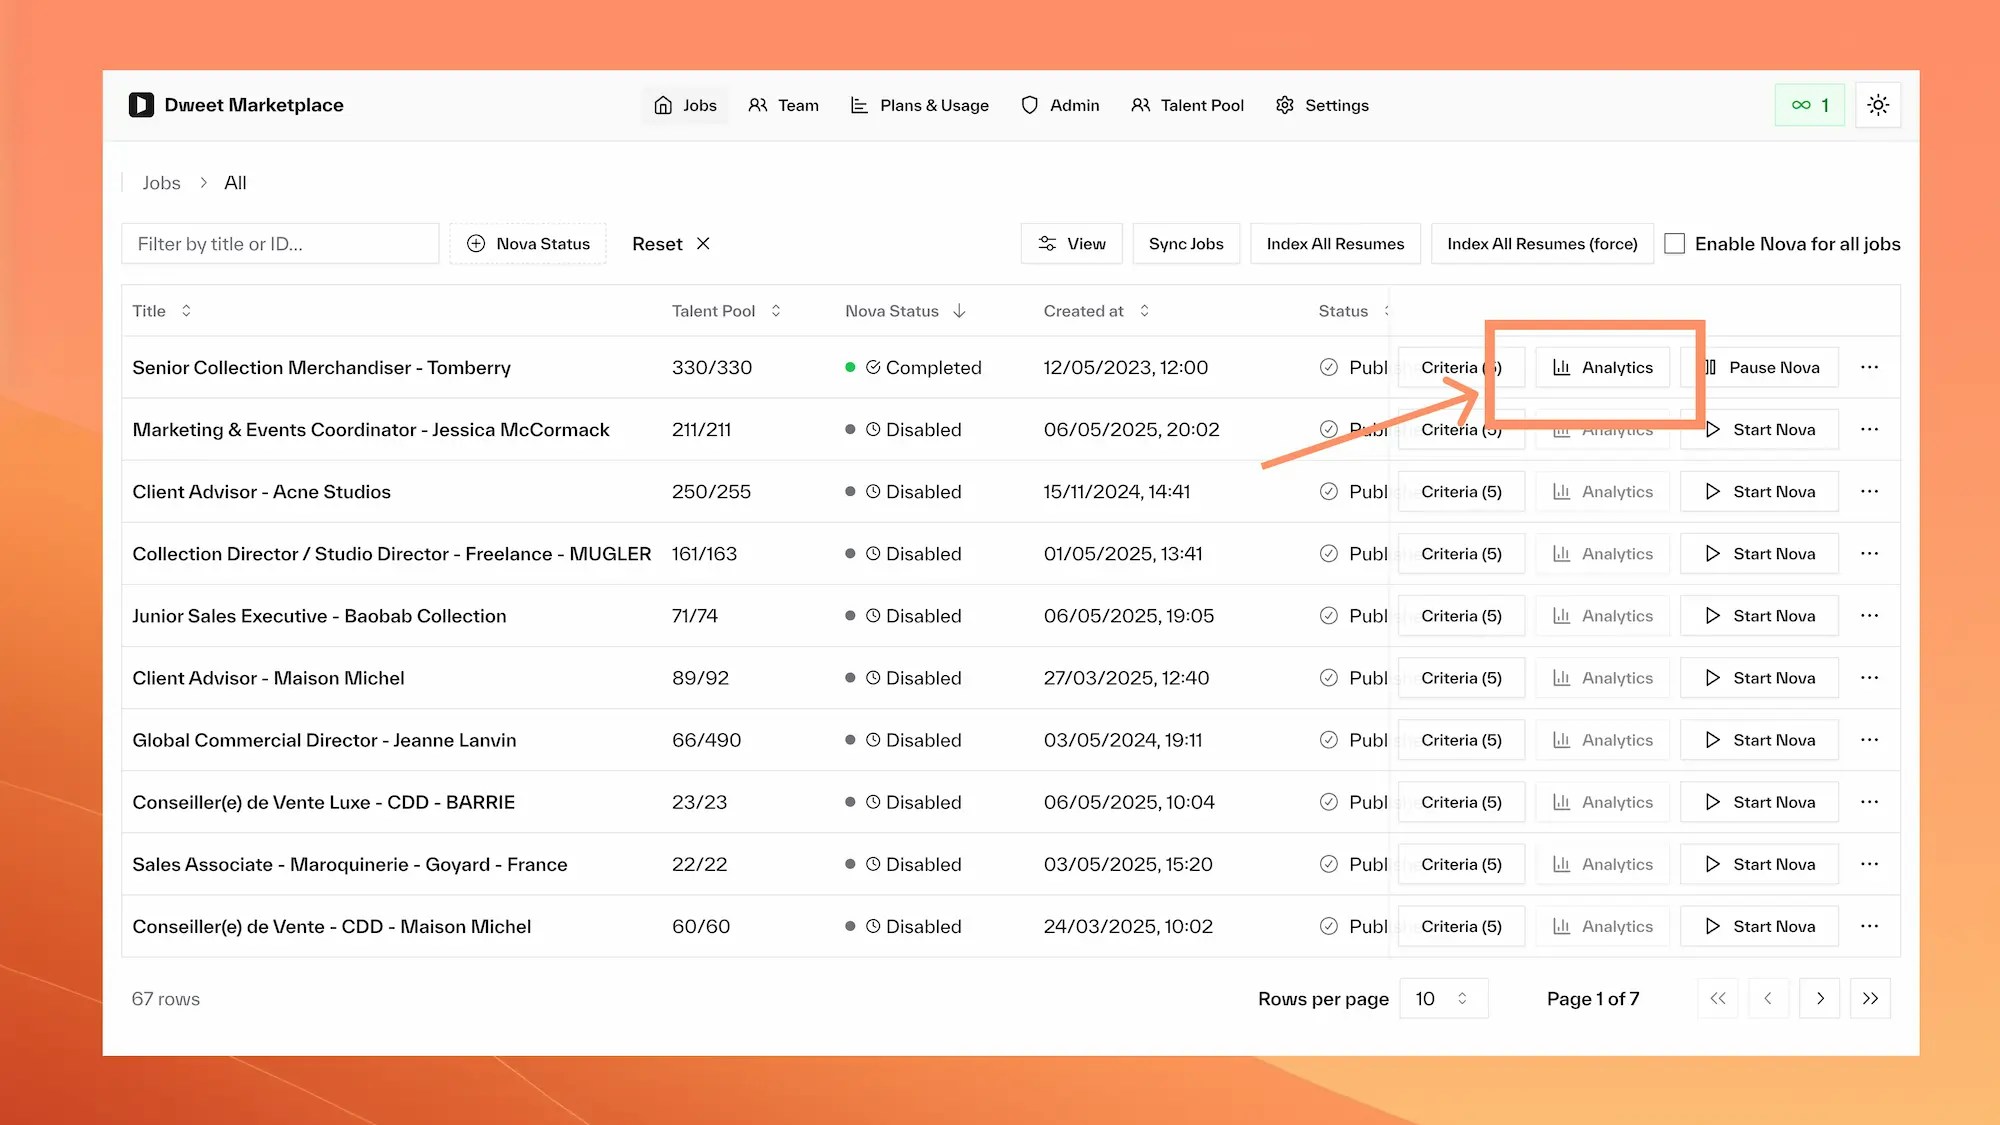
Accessing Analytics
Best Practices
- Regular Monitoring
- Data Interpretation
- Action Planning
Review Schedule:
- Check analytics weekly during active recruitment
- Monitor score distribution after criteria changes
- Track trends over monthly and quarterly periods
- Review analytics before hiring team meetings
- Percentage of candidates scoring 7+ (target: 15-25%)
- Average score trends (look for consistent improvement)
- Application volume vs quality balance
- Time-to-process metrics and efficiency
Frequently Asked Questions
How often do analytics update?
How often do analytics update?
Analytics update in real-time as candidates are scored. You’ll see new data points appear within minutes of applications being processed by Nova.
Can I export analytics data?
Can I export analytics data?
Data export capabilities are planned for future releases. Contact your account manager for specific reporting needs.
What's a good score distribution?
What's a good score distribution?
A healthy distribution typically shows 15-25% of candidates scoring 7+, with most candidates in the 4-7 range. Very high percentages of 9-10 scores may indicate criteria that are too broad.
How do I compare performance across roles?
How do I compare performance across roles?
Cross-role comparison features are coming soon. Currently, you can manually compare analytics between different job postings to identify patterns and best practices.
Can I see historical data?
Can I see historical data?
Yes, analytics include historical trends showing score distribution and quality metrics over time since Nova was enabled for the role.